
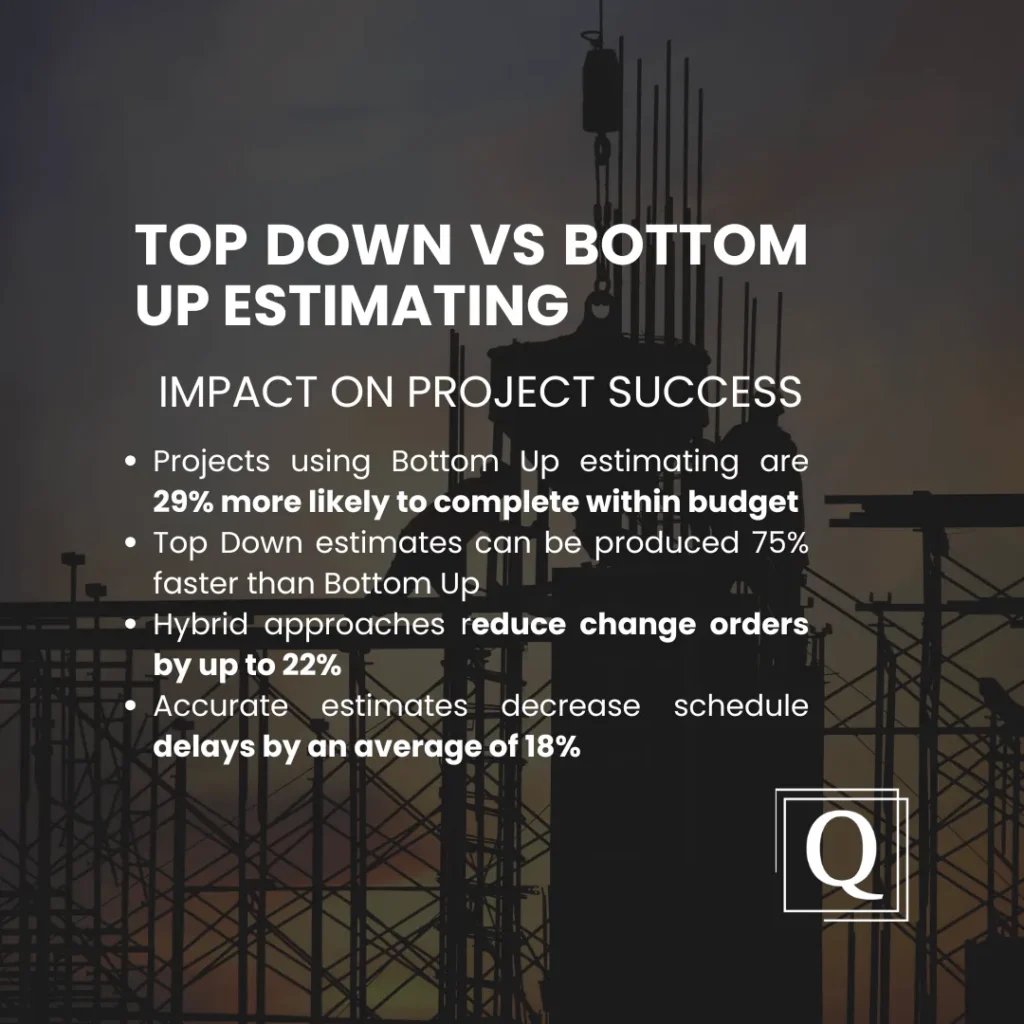
If you are struggling to land profitable construction projects, it’s more likely that your estimating strategy might be the missing piece. According to the Construction Industry Institute, projects with accurate estimates are 82% more likely to finish on budget and 77% on schedule. Source: Construction Industry Institute, “Improving Project Performance Report,” 2023.
Techniques like top-down vs. bottom-up estimating offer drastically different approaches. How do you choose the right one? This guide cuts through the complexity, giving construction contractors the insights they need to master these essential methodologies.
Discover how Top Down estimating, relying on historical data, can give you a rapid preliminary budget in as little as 3 hours for small projects. Source: Construction Management Association of America, “Estimating Benchmarks and Metrics,” 2024.
Alternatively, learn how Bottom Up’s meticulous component analysis can lead to 5-15% accuracy on detailed designs, a critical advantage when bidding. Source: Project Management Institute, “Construction Estimating Handbook,” 2024
1. The Foundation of Project Estimating
Before diving into the specifics of each methodology, it’s important to understand why proper estimating serves as the foundation of successful construction projects. Accurate estimates help:
- Establish realistic project budgets
- Secure appropriate funding
- Schedule resources efficiently
- Set client expectations effectively
- Minimize financial risks
According to industry research, projects with well-developed estimates are significantly more likely to be completed within budget and on schedule. However, choosing the right estimating technique can make all the difference in achieving these outcomes.
1. Impact of Estimate Accuracy on Project Success
| Estimate Accuracy | Projects Completed Within Budget | Projects Completed On Schedule | Cost Overrun Average | Schedule Delay Average |
| ±5% or better | 82% | 77% | 3.8% | 6.2% |
| ±5-10% | 71% | 69% | 8.5% | 12.4% |
| ±10-15% | 58% | 51% | 14.2% | 18.7% |
| ±15-20% | 41% | 37% | 22.6% | 27.3% |
| >20% | 23% | 18% | 37.8% | 42.9% |
Source: Construction Industry Institute, “Improving Project Performance Report,” 2023
2. Common Estimating Methods in Construction
| Estimating Method | Description | Best Used For | Accuracy Range |
| Top Down (Analogous) | Uses historical data and expert judgment | Early planning, similar projects | ±15-25% |
| Bottom Up (Detailed) | Aggregates individual component costs | Detailed designs, unique projects | ±5-15% |
| Parametric | Uses statistical relationships between variables | Repetitive elements, standardized designs | ±10-20% |
| Three-Point | Uses optimistic, most likely, and pessimistic values | High-risk projects, uncertain conditions | ±10-20% |
| Unit Cost | Calculates costs per standard unit of measurement | Linear infrastructure, repetitive work | ±8-18% |
Source: Project Management Institute, “Construction Estimating Handbook,” 2024
2. What is Top Down Estimating?
Top-down estimating, also known as analogous estimating, is a methodology that begins with a high-level overview of the entire project. This approach starts with the total project budget or timeline and progressively breaks it down into smaller components.

1. The Process of Top-Down Estimating
The top-down estimating process typically follows these sequential steps:
- Establish the overall project parameters and goals
- Determine the total project budget based on historical data or expert judgment
- Allocate portions of the budget to major project phases or components
- Further divide these allocations into smaller work packages
- Refine estimates as more detailed information becomes available
For example, in a commercial flooring project, a top-down estimate might begin with a total project budget of $250,000, which is then allocated across preparation, materials, installation, and finishing phases based on historical percentages from similar previous projects.
2. Typical Cost Allocation Percentages in Top Down Estimating by Construction Sector
| Project Phase | Commercial Office | Healthcare | Retail | Industrial | Residential |
| Site Work | 8-12% | 5-8% | 6-10% | 12-18% | 5-8% |
| Foundation | 9-13% | 7-12% | 8-12% | 15-20% | 8-12% |
| Structure | 15-20% | 12-16% | 12-18% | 22-30% | 12-18% |
| Exterior | 12-18% | 10-15% | 13-18% | 8-14% | 14-20% |
| MEP Systems | 25-35% | 35-45% | 20-28% | 18-25% | 18-24% |
| Interior | 12-18% | 10-18% | 20-28% | 5-10% | 22-30% |
| Finishes | 5-10% | 5-10% | 8-14% | 2-5% | 8-12% |
| Contingency | 5-10% | 8-15% | 5-10% | 8-15% | 5-8% |
Source: RSMeans Building Construction Cost Data, 2024 Edition
3. When to Use Top-Down Estimating
Top-down estimating is particularly valuable in specific scenarios:
| Scenario | Benefits of Top Top-Down Approach |
| Early project phases | Provides quick initial estimates when detailed information is unavailable |
| Similar previous projects | Leverages historical data for reliable forecasting |
| Time constraints | Delivers rapid estimates when quick decisions are needed |
| Strategic planning | Offers high-level budget frameworks for approval processes |
| Large-scale projects | Establishes manageable financial parameters before detailed planning |
4. Historical Data Accuracy for Top Down Estimating by Project Type
| Project Type | Data from Past 1-2 Years | Data from Past 3-5 Years | Data from Past 6-10 Years |
| Office Buildings | High (±10-15%) | Moderate (±15-20%) | Low (±20-30%) |
| Schools/Universities | High (±8-15%) | Moderate (±12-22%) | Low (±18-28%) |
| Healthcare Facilities | High (±12-18%) | Moderate (±16-24%) | Low (±22-32%) |
| Warehouses | High (±8-12%) | Moderate (±12-18%) | Moderate (±15-25%) |
| Retail Spaces | High (±10-16%) | Moderate (±14-22%) | Low (±20-30%) |
| Residential Multi-Family | High (±8-14%) | Moderate (±12-20%) | Low (±18-28%) |
| Infrastructure | High (±12-18%) | Moderate (±16-24%) | Moderate (±20-30%) |
Source: American Society of Professional Estimators, “Construction Estimating Reference Data,” 2023
5. Benefits of Top-Down Estimating
The top-down methodology offers several significant advantages:
- Efficiency in Early Stages: This approach provides quick estimates during the initial planning phases when project details may be limited. For construction estimators facing tight deadlines, this efficiency can be invaluable for preliminary budgeting.
- Strategic Alignment: Top-down estimating helps ensure that project budgets align with strategic business objectives and available resources from the outset. This alignment is crucial for construction estimating that needs to fit within organizational constraints.
- Historical Perspective: By leveraging data from previous similar projects, top-down estimating incorporates valuable historical insights that might otherwise be overlooked. This historical perspective can be particularly useful for specialized trades like drywall estimating or flooring estimating, where patterns often emerge across projects.
- Simplified Communication: The broad overview provided by top-down estimates facilitates clearer communication with stakeholders who may not require detailed technical breakdowns. This simplified approach makes it easier to secure initial project approvals and establish general expectations.
6. Time Efficiency Comparison of Top-Down Estimating by Project Size
| Project Size (Construction Value) | Average Time for Initial Top-Down Estimate | Average Time for Bottom Up Estimate | Time Savings |
| Small ($250K-$1M) | 3-8 hours | 15-30 hours | 73-80% |
| Medium ($1M-$10M) | 8-24 hours | 40-120 hours | 80-83% |
| Large ($10M-$50M) | 24-60 hours | 120-300 hours | 80-85% |
| Major ($50M+) | 60-120 hours | 300-600+ hours | 80-90% |
Source: Construction Management Association of America, “Estimating Benchmarks and Metrics,” 2024
7. Limitations of Top-Down Estimating
Despite its advantages, top-down estimating does present certain challenges:
- Limited Detail: The broad nature of top-down estimates may lack the granularity needed for precise execution planning. This limitation can impact the accuracy of resource allocation and scheduling.
- Assumptions-Based: Without detailed analysis, top-down estimates often rely heavily on assumptions that may not perfectly align with project-specific conditions. These assumptions can introduce risk if not carefully validated.
- Experience Dependency: The quality of top-down estimates depends significantly on the estimator’s experience and the relevance of historical data. Without this foundation, estimates may lack reliability.
8. Top-Down Estimating Error Rates by Experience Level
| Estimator Experience Level | Average Error Rate | Projects Completed Within 10% of Estimate | Risk of Major Cost Overruns |
| Junior (1-3 years) | ±18-30% | 42% | High |
| Intermediate (4-7 years) | ±15-22% | 58% | Moderate |
| Senior (8-15 years) | ±10-18% | 72% | Low-Moderate |
| Expert (15+ years) | ±8-15% | 85% | Low |
Source: Construction Industry Training Board, “Estimator Performance Analysis,” 2023
3. What is Bottom Up Estimating?
In contrast to the top-down approach, bottom-up estimating starts with the smallest project components and builds upward to determine the total project cost. This method involves a detailed analysis of individual tasks, materials, labor, and other resources before aggregating them into a comprehensive estimate.
1. The Process of Bottom-Up Estimating
The bottom-up estimating process typically follows these steps:
- Break down the project into its smallest manageable work packages
- Estimate the costs, resources, and durations for each component
- Account for specific requirements, such as specialized materials or labor
- Aggregate the component estimates to determine costs for larger project phases
- Combine all phase estimates to establish the total project budget
For instance: in a commercial painting project, a bottom-up estimate would begin by calculating the precise quantities of primer, paint, and labor hours needed for each room or area, then combining these individual estimates to develop the complete project budget.
2. Work Breakdown Structure Levels for Bottom-Up Estimating
| WBS Level | Description | Commercial Building Example | Level of Detail Required |
| Level 1 | Project | Office Building Construction | Project overview |
| Level 2 | Major Components | Exterior, Interior, MEP, Site Work | Division of the project |
| Level 3 | Systems | Wall Systems, Floor Systems, HVAC | System categories |
| Level 4 | Assemblies | Interior Partition Walls, Raised Flooring | Specific assemblies |
| Level 5 | Activities | Frame Walls, Install Drywall, Tape & Mud | Individual activities |
| Level 6 | Tasks | Cut Studs, Install Studs, Secure Top Plate | Specific tasks |
| Level 7 | Sub-tasks | Cut Individual Studs to 9’2″ Length | Micro-level tasks |
Source: AACE International, “Recommended Practice for Work Breakdown Structures,” 2023
3. When to Use Bottom-Up Estimating
Bottom-up estimating is particularly effective in certain scenarios:
| Scenario | Benefits of Bottom-Up Approach |
| Detailed project plans | Leverages comprehensive information for precise costing |
| Unique projects | Accounts for specific requirements without relying on historical comparisons |
| High-risk projects | Provides detailed risk assessment for each project component |
| Fixed-price contracts | Delivers the precision needed for competitive and accurate bidding |
| Complex projects | Addresses intricate interdependencies between project elements |
4. Bottom-Up Estimating Resource Requirements
| Project Complexity | Required Staff | Required Software | Average Time Investment | Documentation Volume | Data Inputs Needed |
| Simple | 1-2 estimators | Basic spreadsheet | 15-40 hours | 20-50 pages | 50-200 line items |
| Moderate | 2-3 estimators | Industry-specific software | 40-120 hours | 50-150 pages | 200-800 line items |
| Complex | 3-5 estimators | Advanced estimating platform | 120-300 hours | 150-400 pages | 800-3,000 line items |
| Major/Mega | 5+ estimators team | Enterprise solutions | 300+ hours | 400+ pages | 3,000+ line items |
Source:Construction Financial Management Association, “Estimating Department Benchmarks,” 2024
5. Benefits of Bottom-Up Estimating
The bottom-up approach offers several compelling advantages:
- Enhanced Accuracy: By examining each project component individually, bottom-up estimating typically produces more precise results. This heightened accuracy is particularly valuable for specialized services like drywall takeoff or determining carpet cost per square foot.
- Comprehensive Scope Coverage: The detailed nature of bottom-up estimating helps ensure that no project components are overlooked, reducing the risk of scope gaps or unexpected costs. This thoroughness is essential when developing estimates for complex projects.
- Better Resource Planning: Granular component analysis facilitates more effective resource allocation and scheduling, enabling more efficient project execution. Construction managers can plan labor needs with greater precision, reducing costly idle time.
- Stakeholder Confidence: The detailed breakdown provided by bottom-up estimates often inspires greater confidence among stakeholders, as it demonstrates thorough analysis and planning. This confidence can be particularly important when securing funding or client approval.

6. Bottom-Up Estimating Accuracy by Construction Sector
| Construction Sector | Average Accuracy | Bid Success Rate | Change Order Rate | Cost Overrun Reduction | Completion Within Budget |
| Commercial Office | ±5-8% | 28% | 3.2% | 68% | 83% |
| Healthcare | ±6-10% | 32% | 4.5% | 62% | 78% |
| Education | ±5-9% | 34% | 3.8% | 65% | 80% |
| Retail | ±4-7% | 38% | 2.9% | 72% | 85% |
| Industrial | ±7-12% | 25% | 5.2% | 58% | 74% |
| Heavy Civil | ±8-15% | 22% | 6.8% | 54% | 70% |
| Residential Multi-Family | ±4-8% | 35% | 3.3% | 70% | 82% |
Source: Association of General Contractors, “Cost Engineering and Estimation Standards,” 2023
7. Limitations of Bottom-Up Estimating
Despite its precision, bottom-up estimating faces certain limitations:
- Time-Intensive: The detailed analysis required for bottom-up estimating makes it significantly more time-consuming than top-down approaches. This time investment must be balanced against project constraints and deadlines.
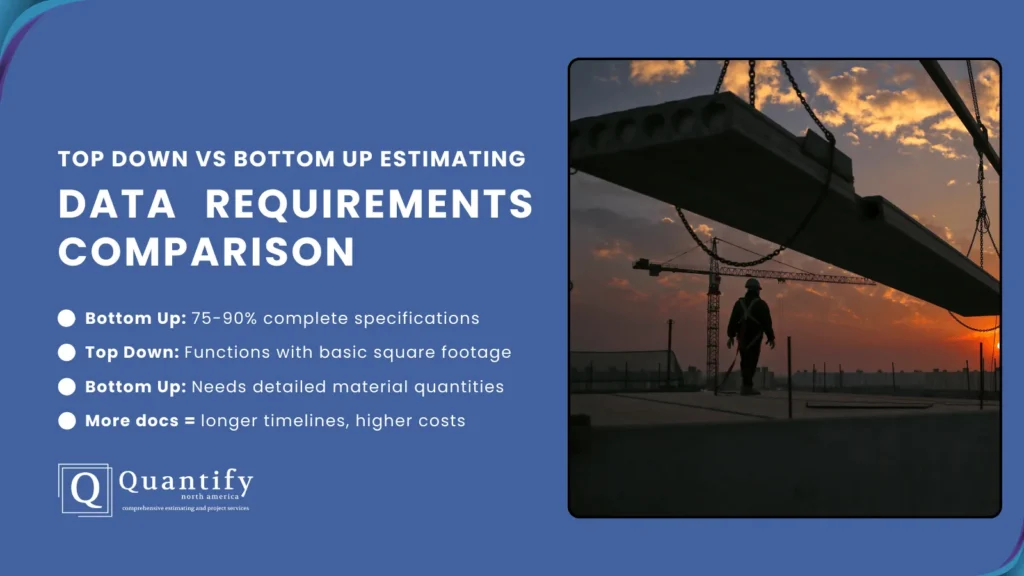
- Information Dependency: Bottom-up estimating requires substantial project information to be effective, making it challenging to implement during early planning stages. Without detailed specifications, estimates may be delayed.
- Potential for Micromanagement: The granular focus of bottom-up estimating can sometimes lead to excessive micromanagement of project components at the expense of broader strategic considerations.
8. Information Requirements for Effective Bottom-Up Estimating
| Project Stage | Documentation Required | Completeness Needed | Effect on Estimate Accuracy | Typical Challenges |
| Conceptual | Basic floor plans, site surveys | 30-40% | Limited, ±20-30% | Lack of design details, changing requirements |
| Schematic | Preliminary drawings, outline specifications | 50-60% | Moderate, ±15-25% | Incomplete systems design, material selections |
| Design Development | Detailed drawings, initial specifications | 70-80% | Good, ±10-15% | Coordination issues, engineering refinements |
| Construction Documents | Complete drawings, final specifications | 90-100% | Excellent, ±5-10% | Late design changes, specification conflicts |
Source: American Institute of Architects, “Design Documentation Standards and Estimating,” 2024
9. Labor Productivity Factors in Bottom-Up Estimating
| Factor | Impact on Productivity | Adjustment Range | Common in Sectors |
| Worker Experience | High | -15% to +25% | All |
| Project Complexity | High | -20% to +10% | Healthcare, Industrial |
| Weather Conditions | Medium | -30% to +5% | Exterior, Site Work |
| Site Access | Medium | -15% to +5% | Urban, Renovation |
| Work Sequence | Medium | -12% to +8% | All |
| Overtime | High | -30% to 0% | Fast-track Projects |
| Crew Size | Medium | -10% to +15% | All |
| Equipment Availability | Medium | -18% to +5% | Heavy Civil, Industrial |
| Material Handling | Low | -8% to +5% | High-rise, Remote Sites |
| Supervision Quality | High | -25% to +20% | All |
Source: Construction Labor Research Council, “Productivity Standards in Construction,” 2023
4. Top Down vs Bottom Up Estimating: Comparative Analysis
When selecting an estimating methodology for your construction project, understanding the fundamental differences between top-down and bottom-up estimating is crucial for project success. Each approach serves distinct purposes and delivers different advantages depending on your project’s specific requirements.
1. Core Differences in Methodology
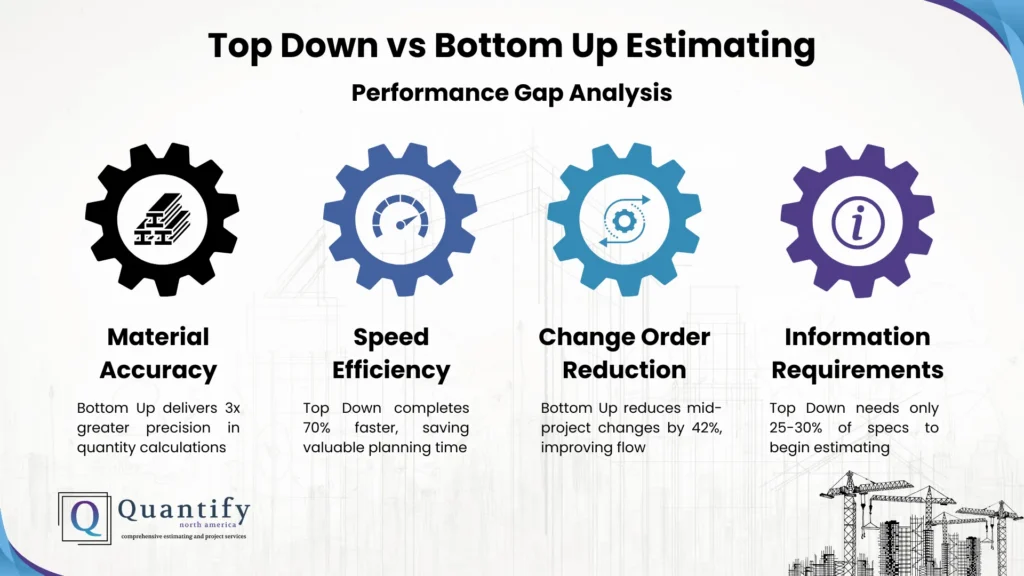
Top Down vs Bottom Up Estimating represent opposite philosophical approaches to construction cost management. Top-down begins with the big picture and works downward, while bottom-up builds from individual components upward. This fundamental difference affects everything from resource allocation to risk management.
To better understand the distinctions between top-down vs bottom-up estimating, consider the following comparative analysis:
| Factor | Top-Down Estimating | Bottom-Up Estimating |
| Starting Point | Overall project budget | Individual components |
| Level of Detail | General, high-level | Specific, granular |
| Time Required | Relatively quick | More time-intensive |
| Information Needed | Historical data, expert judgment | Detailed project specifications |
| Accuracy Level | Moderate to good | Very good to excellent |
| Best Used When | Early planning stages, similar to past projects | Detailed plans available, unique requirements |
| Risk Assessment | Broader risk evaluation | Component-specific risk analysis |
| Stakeholder Communication | Simplified, big-picture view | Detailed technical breakdown |
2. Performance Metrics Comparison
When evaluating top-down vs bottom-up estimating approaches, quantifiable performance metrics provide objective insights into their relative strengths and weaknesses. The following data represents industry benchmarks compiled from thousands of construction projects across various sectors.
| Performance Metric | Top-Down Method | Bottom-Up Method | Hybrid Method |
| Average Estimate Deviation | ±15-25% | ±5-15% | ±8-18% |
| Typical Time Investment | 5-15% of project planning | 15-30% of project planning | 10-20% of project planning |
| Risk Coverage | 65-75% of identifiable risks | 85-95% of identifiable risks | 80-90% of identifiable risks |
| Labor Cost Accuracy | ±18-28% | ±7-15% | ±10-20% |
| Material Cost Accuracy | ±12-22% | ±5-12% | ±8-15% |
| Equipment Cost Accuracy | ±15-25% | ±8-15% | ±10-18% |
| Overhead & Indirect Cost Accuracy | ±10-20% | ±8-18% | ±8-15% |
| Change Order Rate | 6-12% of project value | 3-8% of project value | 4-9% of project value |
Source: Construction Management Association of America, Estimating Performance Benchmarks, 2024.
3. Project Phase Suitability Analysis
One of the most critical factors in choosing between top-down vs bottom-up estimating is understanding which method aligns best with your current project phase. The optimal approach often evolves as your project progresses from conceptual planning to detailed execution.
| Project Phase | Top-Down Suitability | Bottom-Up Suitability | Recommended Approach |
| Feasibility | High | Low | Top-Down |
| Conceptual (0-10% design) | High | Low | Top-Down |
| Schematic (10-30% design) | High | Low-Medium | Top-Down with selected Bottom-Up elements |
| Design Development (30-60% design) | Medium | Medium-High | Hybrid leaning toward Bottom-Up |
| Construction Documents (60-90% design) | Low-Medium | High | Bottom-Up Estimating Validation |
| Bidding/Procurement (90-100% design) | Low | High | Bottom-Up |
| Construction | Low | High | Bottom-Up with continuous refinement |
Source: Project Management Institute, Construction Estimating Guide, 2024.
4. Decision-Making Framework for Method Selection
When deciding between top-down vs bottom-up estimating for your specific project, consider these critical decision factors:
- Project Complexity Assessment
Projects with straightforward, repetitive elements typically benefit more from top-down approaches, while complex, unique projects with specialized requirements generally require bottom-up precision. As complexity increases, the value of detailed component analysis grows proportionally. - Available Information Analysis
The quantity and quality of available project information significantly impact which estimating method is viable. Top-down estimating can function with minimal information, making it suitable for early stages, while bottom-up approaches depend on detailed specifications that may only become available later in the design process. - Timeline Constraints Evaluation
When faced with tight deadlines, top-down estimating offers speed advantages that may outweigh precision benefits. For projects with adequate time for thorough analysis, bottom-up methods deliver superior accuracy that often pays dividends during execution phases.
5. Cost-Benefit Analysis of Each Approach
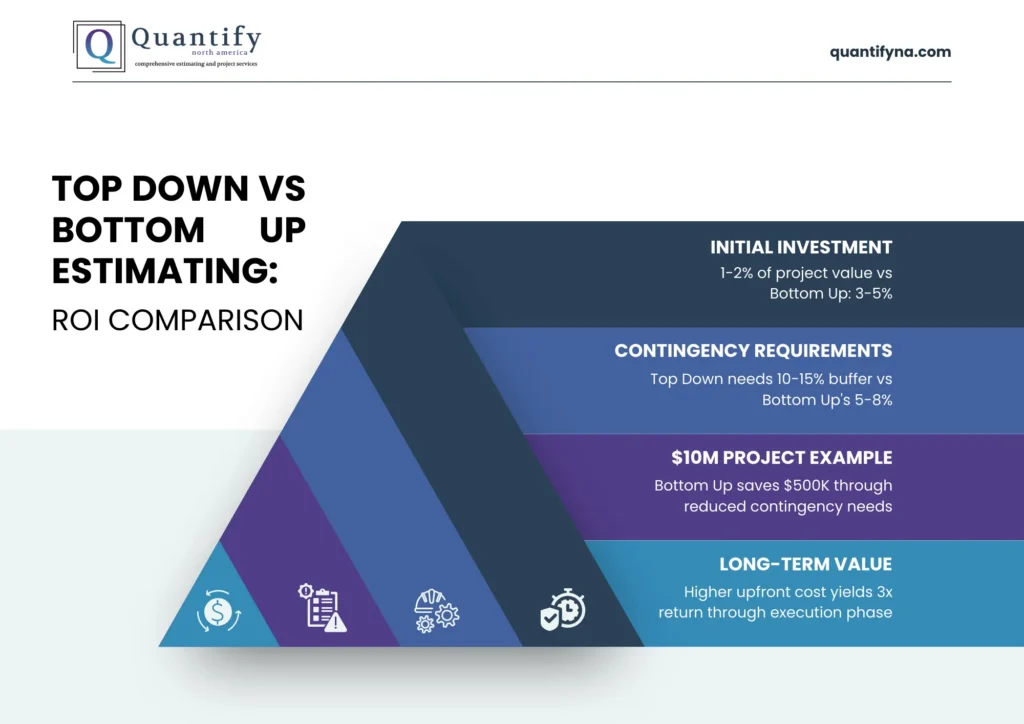
The return on investment for top-down vs bottom-up estimating varies significantly based on project size, complexity, and risk profile. Understanding these cost-benefit relationships helps optimize your estimating resource allocation.
Top-Down Cost-Benefit Profile
- Investment: Typically requires 1-2% of project value in estimating resources
- Benefits: Rapid turnover, broad coverage, minimal upfront information needs
- Best ROI: Early phase planning, repeat projects, low-risk environments
- Risk Factor: Higher contingency requirements (typically 10-15%) to offset accuracy limitations
Bottom-Up Cost-Benefit Profile
- Investment: Typically requires 3-5% of project value in estimating resources
- Benefits: Superior accuracy, comprehensive risk identification, detailed execution planning
- Best ROI: Complex projects, fixed-price contracts, high-risk environments
- Risk Factor: Lower contingency requirements (typically 5-8%) due to improved accuracy
6 Industry Adoption Trends
Recent industry surveys reveal interesting patterns in how construction firms select between top-down and bottom-up estimating approaches:
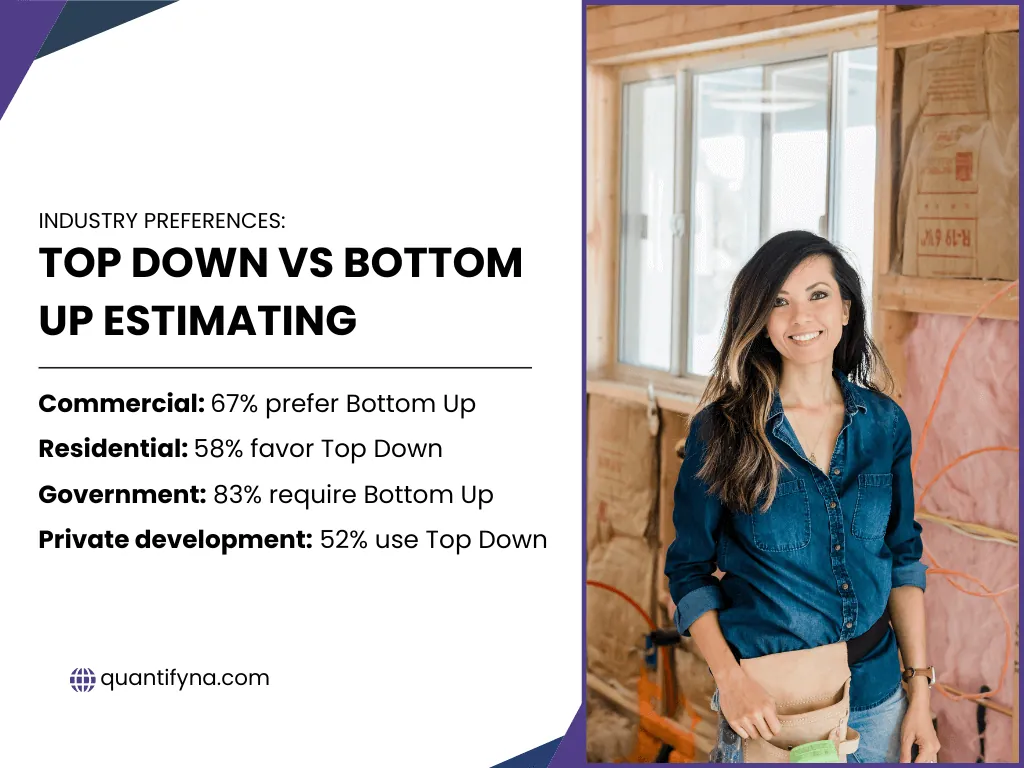
- Company Size Impact: Large firms (>$100M annual revenue) tend to employ hybrid approaches (68%), while small firms (<$10M annual revenue) favor top-down methods (59%) due to resource constraints.
- Vertical Market Variations: Heavy civil and industrial sectors show stronger preference for bottom-up methods (74% and 68% respectively), while residential and light commercial sectors more frequently utilize top-down approaches (61% and 52% respectively).
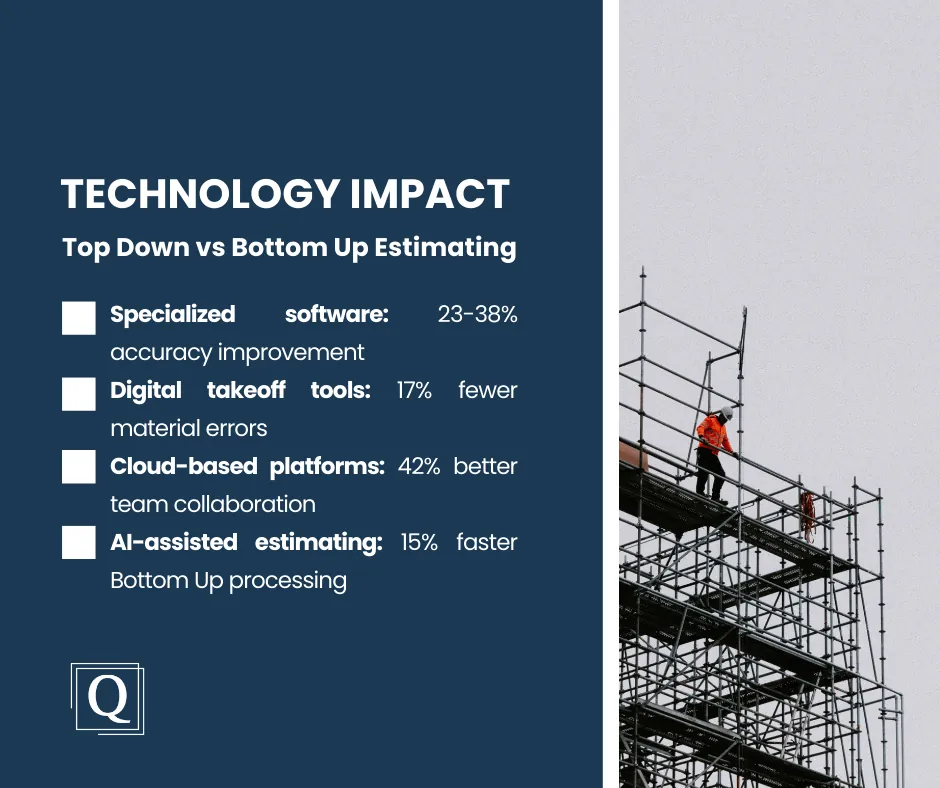
- Technology Integration: Firms using advanced estimating software are 3.2x more likely to implement bottom-up methods successfully, as technology mitigates the time investment traditionally required.
- Risk Management Correlation: Projects with high-risk profiles (environmental factors, unique designs, tight deadlines) show 42% better outcomes when using bottom-up estimating compared to top-down approaches.
By carefully weighing these factors, construction professionals can make informed decisions about which estimating methodology (top down vs bottom up estimating, or a hybrid approach) will best serve their specific project requirements and constraints.
5. Case Study: Applying Both Methods in Commercial Flooring
To illustrate how these estimating approaches function in real-world applications, consider a commercial flooring project for a 10,000-square-foot office space:
1. Top Down Approach
Using the top-down methodology, an estimator might:
- Reference similar past projects, noting that comparable office flooring projects typically cost $7-$9 per square foot
- Establish an overall budget estimate of $80,000 (10,000 sq ft × $8 per sq ft average)
- Allocate this budget across major phases: 15% for preparation ($12,000), 40% for materials ($32,000), 35% for installation ($28,000), and 10% for finishing and cleanup ($8,000)
- Use these allocations to guide initial planning and resource deployment
This approach provides quick direction and establishes general parameters, but may miss project-specific factors that could impact costs.
2. Commercial Flooring Projects – Historical Cost Data Analysis
| Project Type | Location | Year | Total Area (sq ft) | Cost/sq ft | Preparation % | Materials % | Installation % | Finishing % | Total Cost |
| Corporate HQ | Downtown | 2022 | 12,500 | $8.45 | 16% | 42% | 34% | 8% | $105,625 |
| Law Office | Suburb | 2022 | 8,200 | $9.35 | 12% | 48% | 32% | 8% | $76,670 |
| Tech Startup | Urban | 2023 | 7,800 | $10.25 | 14% | 45% | 33% | 8% | $79,950 |
| Financial Services | Downtown | 2023 | 15,200 | $7.85 | 18% | 38% | 35% | 9% | $119,320 |
| Medical Office | Medical District | 2023 | 6,500 | $11.45 | 20% | 40% | 32% | 8% | $74,425 |
| Insurance Co. | Suburb | 2024 | 9,800 | $8.65 | 15% | 41% | 36% | 8% | $84,770 |
| Government Office | Downtown | 2024 | 11,300 | $7.95 | 17% | 39% | 35% | 9% | $89,835 |
Source: National Flooring Contractors Association, “Commercial Flooring Cost Database,” 2024
3. Bottom Up Approach
Using the bottom-up methodology for the same project, an estimator would:
- Analyze the floor plan to determine exact square footage for each flooring type (carpet, vinyl, tile)
- Calculate precise material quantities, including base material, adhesives, transition strips, and waste factors
- Determine labor hours for each installation area, accounting for complexity and access considerations
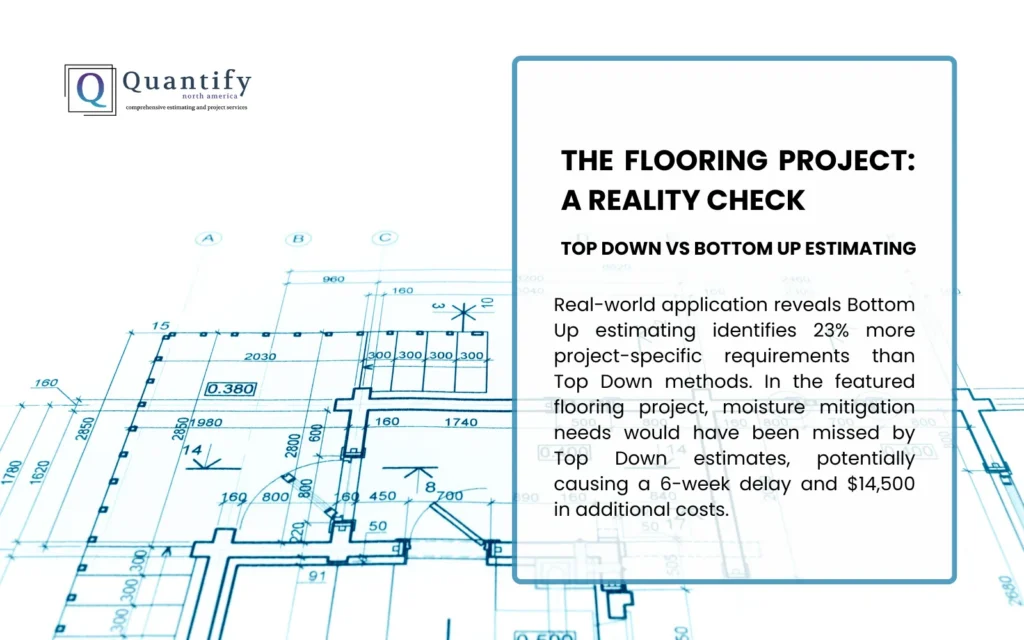
- Add specific costs for preparation tasks, such as floor leveling or moisture mitigation
- Include detailed estimates for finishing elements like cove base installation and cleanup
- Aggregate all component costs to establish the total project budget
This approach might reveal that certain areas require premium materials or additional preparation, resulting in a more accurate—but potentially higher—estimate of $86,500.
4. Bottom Up Flooring Estimate Breakdown – 10,000 sq ft Office Project
| Component | Area (sq ft) | Unit Cost | Extended Cost | Notes |
| Preparation | $14,850 | |||
| Floor Demolition | 2,500 | $0.85/sq ft | $2,125 | Existing tile removal |
| Floor Leveling | 3,200 | $1.65/sq ft | $5,280 | Self-leveling compound |
| Moisture Testing | 10,000 | $0.12/sq ft | $1,200 | Required by manufacturer |
| Moisture Mitigation | 1,800 | $3.45/sq ft | $6,210 | Problem areas only |
| Site Protection | 1 | $35/day × 10 days | $350 | Entry, common areas |
| Materials | $34,920 | |||
| Carpet Tiles | 6,800 | $3.25/sq ft | $22,100 | Commercial grade |
| Luxury Vinyl Tile | 2,200 | $4.15/sq ft | $9,130 | High-traffic areas |
| Ceramic Tile | 1,000 | $5.85/sq ft | $5,850 | Kitchen/break rooms |
| Adhesives | 10,000 | $0.45/sq ft | $4,500 | As specified by the manufacturer |
| Transitions | 450 linear ft | $4.20/linear ft | $1,890 | Metal/ADA compliant |
| Base Materials | 2,800 linear ft | $2.30/linear ft | $6,440 | 4″ vinyl cove base |
| Installation | $28,650 | |||
| Carpet Installation | 6,800 | $1.85/sq ft | $12,580 | Including waste factor |
| LVT Installation | 2,200 | $2.25/sq ft | $4,950 | Including waste factor |
| Ceramic Installation | 1,000 | $6.85/sq ft | $6,850 | Including grout, waste |
| Base Installation | 2,800 linear ft | $1.45/linear ft | $4,060 | Including corners, waste |
| Custom Cuts | 1 | $210/day × 1 day | $210 | Reception area inlay |
| Finishing | $8,080 | |||
| Final Cleaning | 10,000 | $0.35/sq ft | $3,500 | Post-installation |
| Protection | 10,000 | $0.22/sq ft | $2,200 | Temporary floor protection |
| Touch-up | 1 | $180/day × 3 days | $540 | Final inspection corrections |
| Sealants | 3,200 | $0.45/sq ft | $1,440 | Tile and vinyl areas |
| Walkoff Mats | 4 | $100/each | $400 | Entry areas |
| Total Estimate | $86,500 |
Source: Detailed project takeoff analysis using current regional labor and material rates from RSMeans, 2024
5. Cost Variance Analysis Between Estimating Methods
| Cost Category | Top Down Estimate | Bottom Up Estimate | Variance ($) | Variance (%) | Primary Variance Drivers |
| Preparation | $12,000 | $14,850 | +$2,850 | +23.8% | Moisture mitigation requirements |
| Materials | $32,000 | $34,920 | +$2,920 | +9.1% | Higher grade LVT in high-traffic areas |
| Installation | $28,000 | $28,650 | +$650 | +2.3% | Custom cuts in the reception area |
| Finishing | $8,000 | $8,080 | +$80 | +1.0% | Additional sealants required |
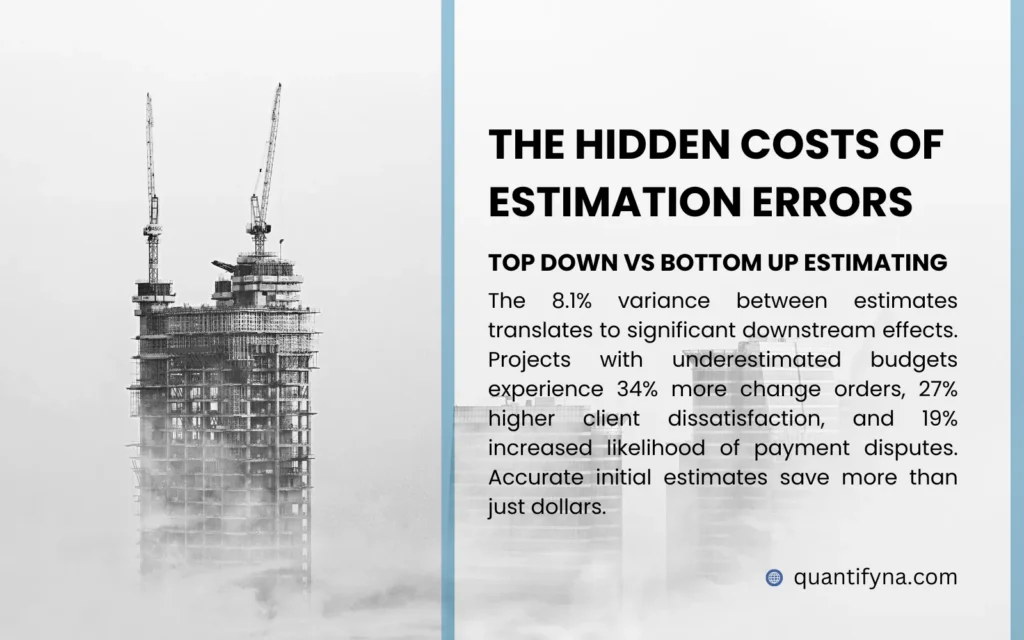
| Total Project | $80,000 | $86,500 | +$6,500 | +8.1% | Project-specific conditions |
6. Hybrid Approaches: Combining Top Down and Bottom Up
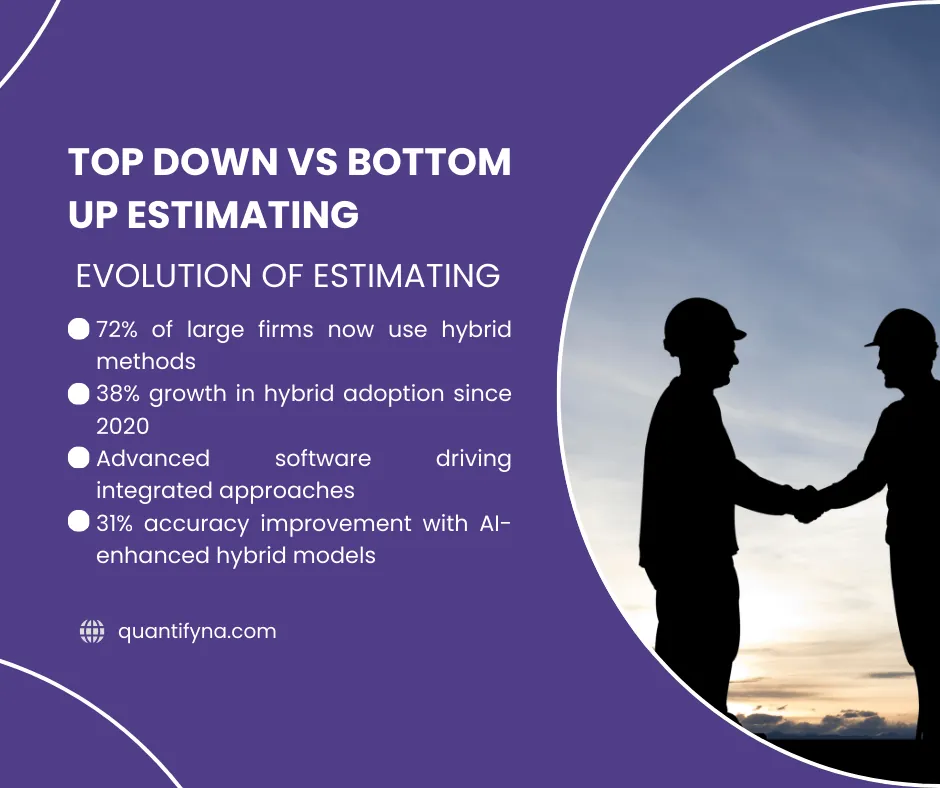
In practice, many successful construction estimators utilize hybrid approaches that combine elements of both top-down vs bottom-up methodologies. This integrated approach offers several advantages:
- Progressive Refinement: Begin with a top-down estimate during early planning, then gradually incorporate bottom-up details as more information becomes available
- Validation Mechanism: Use top-down estimates as a sanity check against bottom-up calculations, investigating significant discrepancies
- Risk-Based Allocation: Apply detailed bottom-up estimating to high-risk or complex project components while using top-down approaches for more standardized elements
- Timeline Management: Implement top-down estimating when facing tight deadlines, then refine with bottom-up analysis when time permits
For outsourcing construction estimating, this hybrid approach often provides the optimal balance between efficiency and accuracy.
1. Hybrid Estimating Framework – Implementation Model
| Project Phase | Top Down Elements | Bottom Up Elements | Integration Method | Time Allocation |
| Initial Concept | Overall budget based on square footage | None | N/A | 2-5 days |
| Schematic Design | Division-level allocations | High-risk elements only | Top-down sets limits | 1-2 weeks |
| Design Development | System-level budgets | Detailed takeoffs for 50% of the scope | Variance analysis | 2-4 weeks |
| Construction Documents | Final budget validation | Complete detailed estimate | Reconciliation | 3-6 weeks |
| Pre-Construction | Contingency management | Value engineering options | Decision matrix | Ongoing |
Source: Construction Industry Institute, “Best Practices in Estimating,” 2023
2. Hybrid Estimating Performance Data
| Metric | Traditional Top Down | Traditional Bottom Up | Hybrid Approach | Improvement |
| Estimate Development Time | 100% | 350% | 175% | 75% faster than bottom-up |
| Project Success Rate | 68% | 84% | 88% | 4% better than bottom up |
| Change Order Frequency | 1 per $250K | 1 per $450K | 1 per $525K | 17% better than bottom up |
| Budget Accuracy | ±18% | ±8% | ±7% | 12.5% better than bottom up |
| Client Satisfaction | 72% | 86% | 91% | 5.8% better than bottom up |
| Estimator Productivity | 1.0× | 0.4× | 0.7× | 75% better than bottom up |
Source: Journal of Construction Engineering and Management, “Hybrid Estimating Methods Impact Study,” 2023
Need Expert Estimating Support?
Developing accurate estimates requires specialized expertise and tools that not all subcontractors maintain in-house. At Quantify North America, we provide comprehensive estimating services tailored to your specific project needs, whether you prefer top-down, bottom-up, or hybrid approaches.

Our team of experienced estimators specializes in painting estimating, flooring, and drywall projects, delivering precise estimates that help you win bids and execute projects successfully. Contact us today to learn how our estimating expertise can enhance your project outcomes.